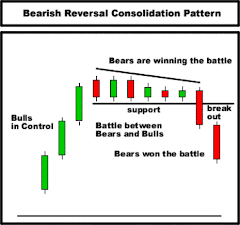
Descending Triangle is a Bearish continuation Pattern. Hence the assumption is there already exists a Down Trend. Descending Triangle Pattern can be explained as follows.
Descending Triangle is a variation of Symmetric Triangle Pattern. The difference between Descending Triangle & Symmetric Triangle is that the lower trend line is flat & upper trend line is falling. This means the Sellers are more aggressive than Buyers. This is a Bearish Pattern & ultimately it results in Downside breakout & Down Trend continues.
Other Continuation Patterns
Technical Analysis Symmetrical Triangle
Technical Analysis Ascending Triangle
Technical Analysis Flags & Pennants Pattern
Technical Analysis Rectangle Formation
| Free Technical Analysis Tutorial |
| Hot Stock Picks |
| Stock Market Tips |


Technical Analysis Descending Triangle
Technical Analysis Flags & Pennants Pattern
Flag & Pennant Formations are very common. There is not much difference between them.
Flags & Pennants Formations are continuation pattern hence assumption is there exists a trend (up trend or down trend). In addition to the trend assumption, they have one more requirement. That they be preceded by sharp & almost straight-line move.
Once price gets breakout from these pattern the original trend continues.
Bullish Flag
Bullish Pennants
Other Continuation Patterns
Technical Analysis Symmetrical Triangle
Technical Analysis Ascending Triangle
Technical Analysis Descending Triangle
Technical Analysis Rectangle Formation
Technical Analysis Rectangle Formation
Rectangle Formation is also known as Trading Range. This is a continuation Pattern. Hence the assumption is there already exists a Trend (Up Trend or Down Trend). It represents a pause in trend, which results in sideways price movement between two parallel horizontal lines. Once the price breaks out of the trading range the original trend continues.
Bullish Rectangle
Bearish Rectangle
Other Continuation Patterns
Technical Analysis Symmetrical Triangle
Technical Analysis Ascending Triangle
Technical Analysis Descending Triangle
Technical Analysis Flags & Pennants Pattern


