Symmetrical Triangle is a continuation Pattern. Hence the assumption is there already exists an Up Trend or Down Trend. Symmetrical Triangle Pattern can be explained as follows.
Symmetric Triangle Pattern represents a pause in the existing trend (up trend or down trend) after which the original trend resumes. If the original Trend is Up Trend, the symmetric triangle is called as Bullish Symmetric Triangle, while for Down Trend it is called as Bearish Symmetric Triangle. 
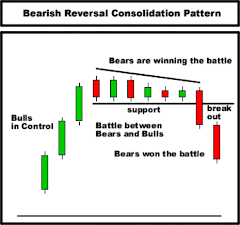
Other Continuation Patterns
Technical Analysis Ascending Triangle
Technical Analysis Descending Triangle
Technical Analysis Flags & Pennants Pattern
Technical Analysis Rectangle Formation
| Free Technical Analysis Tutorial |
| Hot Stock Picks |
| Stock Market Tips |


Technical Analysis Symmetrical Triangle
Subscribe to:
Post Comments (Atom)


2 comments:
This is a wonderful website!! ありがとう。 Thank you!!
I'd be pleased if you exchange reciprocal link with me.
お互い頑張りましょう。
この記事の中でリンクしています。(2010/02/19)
http://easy-happy-invest.blogspot.com/2010/02/day-chart-technical-analysis.html
よかったらご覧になってください。
I am really happy to say it’s an interesting post to read. I learn new information from your article, you are doing a great job. Keep it up. This Blog is interesting and please check out for more information Safety Bollards in Australia .
Post a Comment