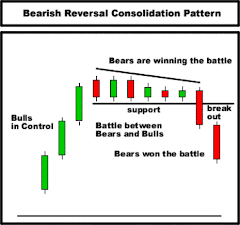
Charts are important tools used in making a technical analysis of the stock market. Though the fluctuations are marked daily on the charts, for an untrained eye it could be a bit of time before it would be able to fully understand the implications of the variations in the charts from one day to another. Candlestick charts could be very confusing at the outset, mostly because the number of indicator shapes in use is about twenty in number.
However, once the person is well-familiarized with the charts, he/she would be in a better position to predict the price movements precisely.Patterns are something that a technical analyst needs to understand fully well. These go a long way in helping to predict market trends. The analyst will often encounter the Cup and Handle pattern, in which the prices would begin at a high, reach a low level and then begin to rise again, forming a pattern much like a cup.
If the cup levels out for a while before rising, then that region is known as a handle on the pattern. Those investors who buy at the handle are buying at the time when the prices are predicted to break out higher. So they stand making very good profits.One more interesting pattern is the Head and Shoulders. This pattern consists of three peaks – the first is a tiny bump-like peak, followed by a big peak and then another tiny peak.
It looks like a head surrounded by two shoulders. This pattern is not a good pattern to invest in. It is indicative of a bearish pattern, which is likely to dip more after the second peak.Apart from the patterns there are several indicators that an analyst must be aware of. The four most important kinds of indicators are the moving average indicator, relative strength index, money flow index and the Bollinger bands.
1. Moving Average Indicator – This is the most commonly used indicator which shows the average price of a stock over a period of time. It works like an average. Suppose the moving average indicator is for thirty days, then the closing prices of the thirty days must be added and then divided by thirty. Commonly used periods are twenty, thirty, fifty, hundred and two hundred days. More the number of days considered, more stable is the index. Representation of the moving average indicator is done with a line graph. When the price falls below the line, it tends to keep on falling; but if it rises above the graph, then it tends to keep on rising.
2. Relative Strength Index – This index compares the number of days the prices are up with the number of days the prices are down. The average of the number of up days is divided with the average of the number of down days. 1 is added to the number obtained, and then it is divided from 100, and then 100 is subtracted from it. The number so obtained is the relative strength index. The relative strength index is calculated from smaller time spans, such as for 9 or 15 days. Relative strength indices range from 0 to 100. If this index goes below 30, then it may be a good time to buy as the stocks could be overbought. Bullish or bearish nature of markets has a strong influence on whether this index would be of any use or not.
3. Money Flow Index – This index is calculation from the number of shares that are traded as well as the prices they are traded for. Again this is a number from 0 to 100, with 70 being the point above which the stock must be sold, and 30 being the point below which the stock must be bought.
4. Bollinger Bands – The very popular Bollinger bands are actually a set of three horizontal lines. Actually only the upper and lower lines are of relevance. If these lines are far apart, it means that the market is volatile and prices could change with rapidity. But if the bands are closer, then the market is stable. If the prices are moving closer to the lower band, then the stock is oversold and the prices will rise. The opposite case happens if the prices are moving closer to the upper band. Bollinger bands are not often used as independent indicators. They are used in conjunction with other indicators as a sort of confirmation.
This free Finance article is brought to you by http://www.articlevista.comAdam is a professional freelance writer the website loan guide. We have lots of awesome info on the topics of Bad Credit Secured Loan, all the way to loan. We encourage you to visit us today and see all we have to offer.
| Free Technical Analysis Tutorial |
| Hot Stock Picks |
| Stock Market Tips |


Understanding Technical Analysis Part One
Subscribe to:
Post Comments (Atom)


No comments:
Post a Comment