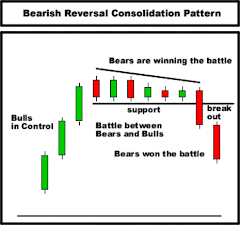
Rectangle Formation is also known as Trading Range. This is a continuation Pattern. Hence the assumption is there already exists a Trend (Up Trend or Down Trend). It represents a pause in trend, which results in sideways price movement between two parallel horizontal lines. Once the price breaks out of the trading range the original trend continues.
Bullish Rectangle
Bearish Rectangle
Other Continuation Patterns
Technical Analysis Symmetrical Triangle
Technical Analysis Ascending Triangle
Technical Analysis Descending Triangle
Technical Analysis Flags & Pennants Pattern
| Free Technical Analysis Tutorial |
| Hot Stock Picks |
| Stock Market Tips |


Technical Analysis Rectangle Formation
Subscribe to:
Post Comments (Atom)


No comments:
Post a Comment